Barometric pressure in Port Said today
Falling
Apart from the daily swing, pressure has eased down over the past day. It now reads 2 hPa lower than at this time yesterday. Next, it holds near this level until tomorrow morning, then falls steadily until tomorrow afternoon. After that it moves between 1017 and 1020 hPa until Thursday afternoon, then rises steadily until Friday morning, then from Friday night falls steadily until Saturday night.
Current sea-level reading for Port Said, as of 21:00 local time.
Pressure graph: the past week and the week ahead
The shaded part shows the days already gone. The thicker line is the forecast.
Port Said is at sea level, so a barometer there reads about the same as the sea-level figure.
The week ahead: the pressure forecast day by day
Each day at a glance: which way pressure moves, and how far.
 24° / 18°Eases down to 1019 by the afternoon, and holds there.Show hourly graph
 24° / 17°Eases down to 1017 by the afternoon, then edges back up a little.Show hourly graph24° / 14°Goes between 1017 and 1019 hPa and ends about where it started.Show hourly graph26° / 15°Goes between 1018 and 1020 hPa and ends a little higher.Show hourly graph28° / 15°Goes between 1019 and 1021 hPa and ends about where it started.Show hourly graph27° / 17°Holds near 1019 until morning, then falls steadily to 1017 by the afternoon, and holds there.Show hourly graph24° / 17°Goes between 1016 and 1018 hPa and ends a little higher.Show hourly graph
The day that changes most: Saturday, down 3 hPa.
Hour by hour
| Hour | Weather and temperature | Rain (mm) | Pressure (hPa) |
|---|---|---|---|
| 00:00 |  20° | 1021 | |
| 01:00 | 19° | 1021 | |
| 02:00 | 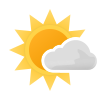 19° | 1021 | |
| 03:00 | 19° | 1020 | |
| 04:00 | 18° | 1020 | |
| 05:00 | 18° | 1020 | |
| 06:00 | 19° | 1020 | |
| 07:00 | 20° | 1021 | |
| 08:00 | 22° | 1021 | |
| 09:00 | 23° | 1021 | |
| 10:00 | 23° | 1021 | |
| 11:00 | 24° | 1020 | |
| 12:00 | 24° | 1020 | |
| 13:00 | 24° | 1020 | |
| 14:00 |  24° | 1019 | |
| 15:00 | 23° | 1019 | |
| 16:00 | 22° | 1019 | |
| 17:00 | 21° | 1019 | |
| 18:00 | 21° | 1019 | |
| 19:00 | 21° | 1020 | |
| 20:00 | 20° | 1020 | |
| 21:00 | 20° | 1020 | |
| 22:00 | 20° | 1020 | |
| 23:00 | 19° | 1019 |
How much the pressure changes in Port Said
In Port Said the pressure changes most from December to April. In a typical November it changes by about 1.5 hPa from one day to the next, and it hardly ever rises or falls by more than 10 hPa.
When the pressure changes most
| Month | More than 5 hPa | More than 10 hPa |
|---|---|---|
| January | 4 | 0 |
| February | 4 | 0 |
| March | 4 | 0 |
| April | 3 | 0 |
| May | 1 | 0 |
| June | 0 | 0 |
| July | 0 | 0 |
| August | 0 | 0 |
| September | 0 | 0 |
| October | 0 | 0 |
| November | 1 | 0 |
| December | 3 | 0 |
A typical day’s change through the year
Each date of the year has its own bar. The taller the bar, the bigger a typical day’s change around that date.
Does the pressure change a lot in Port Said?
Port Said has more days with a change of more than 10 hPa than 46 out of every 100 large cities.
Each dot stands for up to 20 cities with 100,000 people or more. The first column is much taller than shown. Cities higher than 1,000 m are left out, and so are smaller cities within 15 km of a bigger one, unless they are capitals, so that suburbs are not counted twice.
These figures come from ERA5, in which the European weather centre ECMWF rebuilds past weather from a weather model and observations, for an area about 28 km across around Port Said, 1991 to 2020. Each change is the difference between one day’s average pressure and the next day’s.
Cities nearby
Open one to see its pressure, or search for your own city at the top of the page.
More about air pressure
What we have written about how pressure behaves and how it is measured.
Where air pressure changes the most, city by city
Thirty years of data, ranked by city: where air pressure swings most from day to day and where it hardly moves. London, New York, Tokyo and 128 more.
How much does air pressure change in a day?
A normal day moves the barometer about 4 hPa in London and half of one in Singapore. What counts as a big drop, and how often one comes.
Why barometric pressure deserved its own site
Air pressure is the weather number people ask about most and understand least: is it high, is it rising or falling, does it matter today.
Out in the sun today? Check the UV level in Port Said, on our sister site  uvi.today.
Questions about the pressure in Port Said
What is the barometer reading in Port Said right now?
Sea-level pressure in Port Said is 1020 hPa as of 21:00 local time, up 1 hPa over the last three hours.
Is the barometer rising or falling in Port Said today?
Apart from the daily swing, pressure has eased down over the past day. It now reads 2 hPa lower than at this time yesterday. Over the last three hours it has gone up 1 hPa.
Has the pressure in Port Said changed since yesterday?
Yes. At this time yesterday it read 1022 hPa; it is 2 hPa lower now.
What has the pressure in Port Said been over the last few days?
Over the past 7 days it ran between 1019 hPa (this afternoon) and 1025 hPa (a week ago, in the evening). The biggest change in any 24 hours was a fall of 3 hPa, in the 24 hours ending this morning.
Is 1020 hPa high or low pressure?
Atmospheric pressure between about 1000 and 1025 hPa is ordinary at sea level. 1020 hPa is on the high side of ordinary. In Port Said most days average between 1006 and 1022 hPa. The last 24 hours average about 1020 hPa, within that usual range.
What is normal barometric pressure for Port Said?
From 1991 to 2020 the sea-level average for Port Said was 1014 hPa, and most days average between 1006 and 1022 hPa. It is usually highest in December and January and lowest in July and August.
When does barometric pressure change the most in Port Said?
The pressure in Port Said changes most from December to April. Between 1991 and 2020, Port Said had about one day a year with a big change, of more than 10 hPa from one day to the next.
Why does my own barometer show a different number?
Usually altitude. To compare cities, pressure is corrected to sea level. Port Said is at sea level, so there is almost nothing to correct and the two figures agree.
Does falling pressure mean rain?
Not by itself. Away from the tropics, falling pressure usually means a low is approaching, and lows carry the fronts that bring cloud and rain, so the two often arrive together. But a shallow fall can pass with nothing more than cloud, and rain falls under steady pressure too. The graph tells you a system is on the way, not how wet it will be. The week ahead, just above, shows the rain forecast beside the pressure.
